Have you ever wondered how different things can be segmented through machine learning? Or how do recommendation models like Amazon detect similarities among different purchases? Or how can we process natural language for spam filters or chatbots?
In this post, we are going to understand what unsupervised learning is and how it works on a mathematical level. We will take a look at different types of unsupervised learning and analyze their implementations. We will also go through different algorithms that are commonly used as well. There are no programming pre-requisites for this, although to better understand the content in this post, I would recommend you to go through my previous articles on Machine Learning and AI.
Introduction
In supervised learning, the data available to us is generally well defined and labeled, which means we know what different features (input variables) are present, and we can find correlations among them to determine the outcome (response). But in the case of unsupervised learning, the data we receive is generally not well labeled and hence consists of more randomness or makes it difficult for us to predict or determine the response.
Let us understand what we mean when by not well-defined data. As referenced in the previous post on supervised learning, the sales data of a product has many defined factors like the number of impressions (views), traffic distribution (where the customer comes from), and so on.
Now if I have to develop a model that detects the sentiment of a tweet and classifies that into one of the three categories — positive, negative, and neutral, we will require a lot of Twitter data (tweets) and their sentiment, which might be divided manually or through a different program. To use this data and train a model with it, we need to use Unsupervised Learning, because we don't have any defined data, as the different tweets would contain a lot of randomnesses, and there are no labeled factors as well, we will just need to extract information from the tweets and find a pattern among it.
On basis of different use cases, we can classify Unsupervised Learning into two types, association, and clustering.
Association
Association rule learning is a rule-based machine learning method for discovering interesting relations between variables in large databases. ~ Wikipedia
Association algorithms can also be called mining algorithms. In mining algorithms, we analyze the variables and find their correlation with each other. As a very popular example of this, you can think of a database consisting of sales in an online grocery store. So, that database contains many invoices or transactions, and those transactions would contain the number of different items that were purchased and their quantity. Now what we will try to do is, we will try to find relations among different products, so that we can create a recommendation system. Let us say that a common pattern was observed: people who buy Onions and Bread also buy Cheese. So next time, when a person buys onion and bread together, we can give them the recommendation to buy cheese as well.
We find these patterns by performing some mathematical calculations on the data and using the processed data to find the probability of different items that can be purchased after adding certain items to the cart. Let us take a very brief look at how this is done.
Let us say we are going to build a recommendation system for groceries and there are just 5 products that we are selling-Milk, Egg, Flour, Cheese, and Onions.
Now let us create a small data of transactions as well.
+----+------------------+--------------------------+
| | inovice_number | items_purchased |
|----+------------------+--------------------------|
| 0 | 1 | Milk, Egg, Floor |
| 1 | 2 | Milk, Cheese, Onions |
| 2 | 3 | Egg, Floor |
| 3 | 4 | Cheese, Onions |
| 4 | 5 | Egg, Milk, Floor, Cheese |
+----+------------------+--------------------------+
We would also need to learn about a few terms such as support, confidence, and lift, to understand the math behind it.
Support: frequency of items appearing per transaction
So for milk, the support would be 3/5 or 0.6 since milk appears in 3 transactions out of 5. Similarly, support for milk+cheese would be 2/5 or 0.4.
Confidence: frequency of the relation/rule per transaction
So for milk and cheese, if we try to find confidence for milk -> cheese, it would come out as support of milk and cheese divided by the support of milk.
Confidence(milk->cheese) = support(milk+cheese)/support(milk)
                         = 0.4/0.6 = 0.67

Confidence(cheese->onions) = support(cheese+onions)/support(cheese)
                         = 0.4/0.6 = 0.67
Confidence gives us a good idea of how often people buy a product, after previously buying a product.
Lift: Define the strength of the rule/relation
So for milk and cheese, if we try to find the lift for milk -> cheese, it would come out as support of milk and cheese divided by the support of milk into support of cheese.
Lift(milk->cheese) = support(milk+cheese)/(support(milk)*support(cheese))
                         = 0.4/(0.6*0.6) = 1.11
Now the way we determine the strength from the lift is as follows.
lift > 1 : products are related ( greater the lift, stronger the relation )

lift < 1 : products are negatively related, meaning people dont like to buy these together

lift = 1 : products are unrelated
So when we build the recommendation system, we compute lifts for different products and on the basis of their strength, recommend the products to the users.
I can understand if that was way too much maths, but it gives you the core idea of how the association algorithms work.
One of the most popular association algorithms is Apriori which is presently used worldwide to build recommendation engines and sales analysis.
Clustering
Clustering is the task of dividing the population or data points into a number of groups such that data points in the same groups are more similar to other data points in the same group than those in other groups. ~ AnalyticsVidhya
In these algorithms, we try to identify similarities among the data given to us on basis of many available factors, and then group that data into clusters, where each cluster contains data that has more similarity to the data from the same cluster than other clusters.
Some of its common use cases are recommendation systems, customer segmentation, and anomaly detection. For example, if we again have to create a recommendation system for the online grocery store, and we have a lot of customer data, which includes customer details, and their purchases, we can group these customers together into clusters on basis of their purchase patterns. And once, we have clusters of customers with similar patterns, we can now recommend customers from the same clusters of products that we found other customers in the cluster liked or purchased.
This is generally less complex in comparison to the classification algorithms we studied in supervised learning. Although, many people find it hard to distinguish the basic concepts of the classification and clustering algorithms. So, the major difference among these is, that the classification algorithm being a supervised learning algorithm requires well-labeled training data, and uses different algorithms to find a pattern among the variables of training data, and use those to classify, on the other hand, clustering does not require any training data since it uses statistical algorithms or models to find similarities in the data, and divide them into clusters.
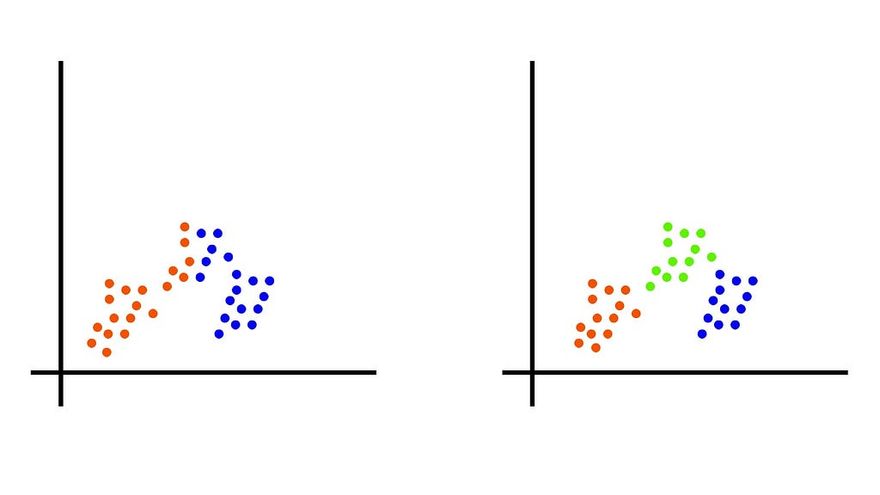
In general, when applying clustering algorithms, we experiment with the number of clusters we want the data to be divided in, and the value that best suits us is used for test cases, and other uses later. For example, the same set of data can be divided into two clusters, as well as three clusters as shown in the figure. Although the three clusters arrangement would be preferable to us since it clusters the data into more accurate and better clusters.
The common algorithms used in clustering are K Means Clustering, BIRCH Algorithm, and Gaussian Mixture Model.
Conclusion
Unsupervised Learning in general is based more on the statistical implementation to find patterns and relations while supervised learning uses the pre-defined algorithms created on the basis of the training data. On basis of our use case, we can use either of these techniques and optimize them to give us more accurate results more efficiently.
I hope you enjoyed reading the post. To follow up with the new articles, do subscribe to the newsletter on my official blog: Thinkfeed.


Latest comments (0)