
Pivot grid is a kind of a component that will appear in any analytical software, CRM systems and any application with statistics. But it is not the thing that is easy to implement and create.
How to correctly adjust the communication between data source and the grid, how to customize its look and functionality for your own business logic? These are only some of the problems you will run into while developing a pivot grid.
So to make your life easier I will show you the tool I use that has saved me days and weeks of work.
WebDataRocks is a simple free library for creating functional and easy-to-use pivot tables. It can be used with Angular, Vue, React or any other framework but besides that you can use it to add some spices into your vanilla data visualization JavaScript project.
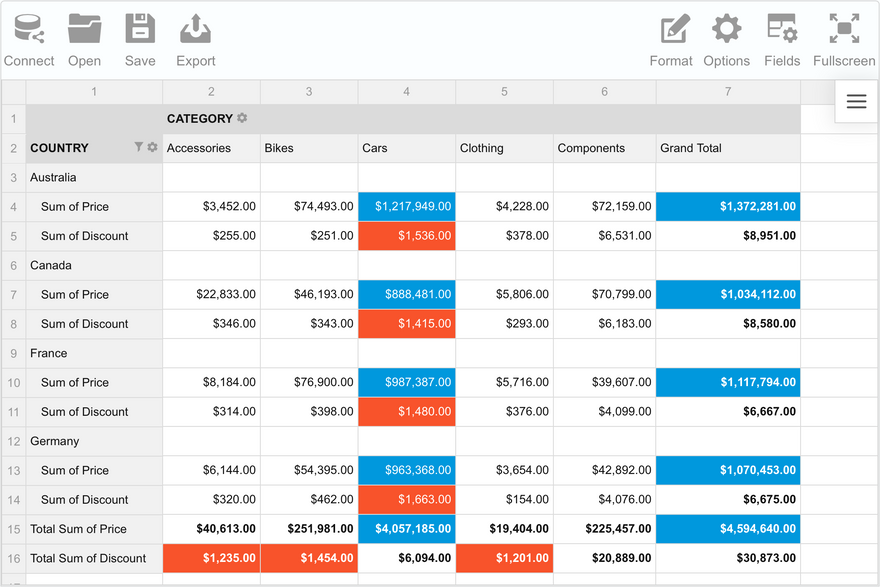
The pivot table contains all the main analyzing features out-of-the-box: sorting, grouping, filtering, conditional formatting. In addition, it is very customizable when talking about the overall look and extra functions. Extensive JavaScript API allows developers to provide smooth interaction of the user with a pivot table component.
Looking at all the other pivot data visualization tools out there, this one is the most comprehensive, easy to use and easy to integrate, yet free.
The implementation is straightforward and fast, you can complete it in less than 10 minutes.
Installation
First step is to get your WebDataRocks into your project. You can download it locally, refer from CDN, or include it with npm package manager.
The easiest way is to use CDN. Simply add the following lines in your HTML file between <body> tags:
<link href="https://cdn.webdatarocks.com/latest/webdatarocks.min.css" rel="stylesheet"/>
<script src="https://cdn.webdatarocks.com/latest/webdatarocks.toolbar.min.js"></script>
<script src="https://cdn.webdatarocks.com/latest/webdatarocks.js"></script>
This will add CSS and JS WebDataRocks files into the project and allow you to create pivot instances on the page.
Initialization
Inside the same HTML file add the script tag with the pivot instance including report information and the path to your dataset:
<script>
var pivot = new WebDataRocks({
    container: "#wdr-component",
    toolbar: true,
    report: {
        dataSource: {
            filename: "https://cdn.webdatarocks.com/data/data.csv"
        }
    }
});
</script>
The data can be in a form of CSV and JSON file.
Customization
In fact, that's all. You can preview your project and see the result in the browser . But apart from that, you can customize the table a bit by adding a localization to it or applying one of the built-in themes.
To translate your component add localization property to the report Object:
report: {
        dataSource: {
            filename: "https://cdn.webdatarocks.com/data/data.csv"
        },
        localization: "https://cdn.webdatarocks.com/loc/es.json"
    }
The component has several built-in localizations but are free to create your own and change the link in the report into your path.
To enhance the look and feel of your web reporting tool and use one of eight predefined themes simply add to the <head>section the <link> element with a reference to a minified CSS file of the desired theme:
<link rel="stylesheet" type="text/css" href="theme/lightblue/webdatarocks.min.css"/>
If there is something you want to change in the design you can also create your own theme.
Wrapping up
With these few simple steps you receive a well-featured Pivot Grid that can load 1MB of data, aggregate it according to your own formulas, pivot the data by changing the slice and finally saving and exporting the final report as you need.


Top comments (2)
Altitude sickness is a common condition experienced by visitors to Vail and other high-altitude locations. It is caused by the decreased availability of oxygen at high altitudes, which can lead to symptoms such as headaches, fatigue, dizziness, nausea, and shortness of breath. Additionally, Altitude Sickness, Vail can range from mild to severe, and in rare cases can be life-threatening. Fortunately, there are a variety of treatments available for altitude sickness in Vail, including rest, hydration, and medications such as acetazolamide.
Sinus surgery is a very common procedure, performed to improve the quality of life for millions of people. It's also one of the most common surgeries in the entire country, with more than 100,000 procedures performed each year. If you are hiring a surgeon for sinus surgery then firstly you should know about what is sinus surgery for best experience. The sinuses are hollow spaces inside your face that have no direct connection to your nose or mouth. They are lined by mucous membranes and filled with air and fluid (sinus drainage).