Have you ever wondered how the defined data gets processed and predictions are drawn? or how we classify the data or understand the patterns from a dataset?
In this post, we will learn about supervised machine learning, and how it works on a mathematical level. We will explore different types of supervised learning and try to analyze their practical implementation. As usual, you do not need any programming experience to understand this, although I really recommend you to have a look at one of the previous blog posts “Artificial Intelligence and Machine Learning” which can be used to better understand the concepts I explain here.
Introduction
In machine learning, we use data and analyze it to determine a pattern among it and use that to draw predictions or classifications. When this data is well defined and labeled, which means when we understand what each of the input parameters represents, and we use particular algorithms to train our model with it, it is classified as Supervised Learning.
For example, if I have a dataset of different real estate properties, which contains many different parameters including the location, plot area, number of bedrooms, bathrooms, and stories, and some other factors as well as the price of the house. I can use Supervised Learning to create an ML model that when provided with these parameters, can predict the price of the property. So, once my model would be prepared, if I would provide it with the location of the house, the area, as well as the other details as input, then it can output me the price of that house.
On the basis of the use case, we can divide Supervised Learning into two types, regressions, and classification.
Regressions
“In statistical modeling, regression analysis is a set of statistical processes for estimating the relationships between a dependent variable (often called the ‘outcome’ or ‘response’ variable) and one or more independent variables (often called ‘predictors’, ‘covariates’, ‘explanatory variables’ or ‘features’).~https://en.wikipedia.org/wiki/Regression_analysis”
In the definition above, you can correlate the independent variables as our input parameters ( more commonly called features ), and the dependent variables as our output ( what we want to predict ).
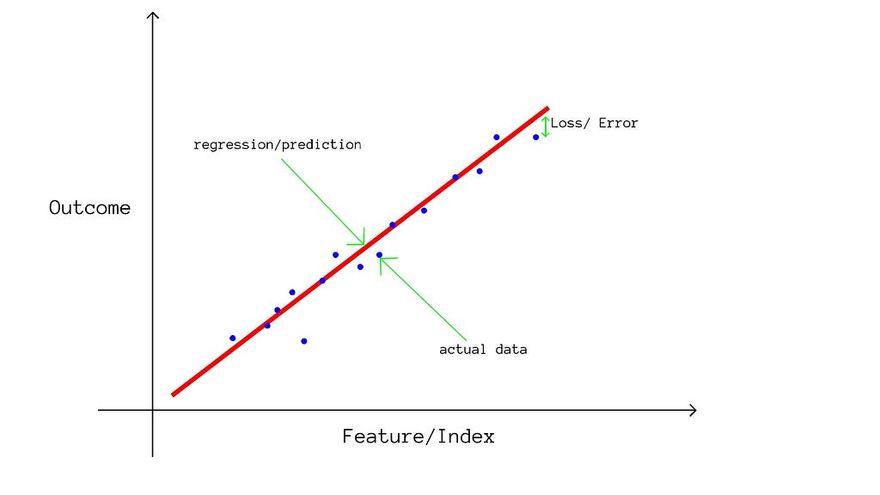
So in the regression, the model tries to find patterns or a relation between the features and the outcome. Just like in our example, the area of the house would have a strong relation ( very correlated ) with the price of the house, since as the area increases, the price of the house also increases. Whereas the features like latitude and longitude may not show a very direct strong relation.
The model trains on the data we provide to it and using that, it comes up with particular weights for each feature, and the higher the weight, the higher the correlation between the feature and outcome. Then it can develop some sort of algorithm with those weights that can predict near accurate or accurate outcomes.
The accuracy of the regressions is generally tested through loss functions that calculate the difference between the predictions of the model and the real outcomes of test data. Depending on the choice of our matrics, calculate the loss.
If you are interested in learning about how the models are evaluated in more depth, then do comment on this post, and I will write an article explaining several kinds of evaluation metrics.
The most common use cases of the regression models include predicting sales of a product, market research, forecasting financial data, and so on.
Classifications
“In statistics, classification is the problem of identifying which of a set of categories (sub-populations) an observation (or observations) belongs to. ~https://en.wikipedia.org/wiki/Statistical_classification”
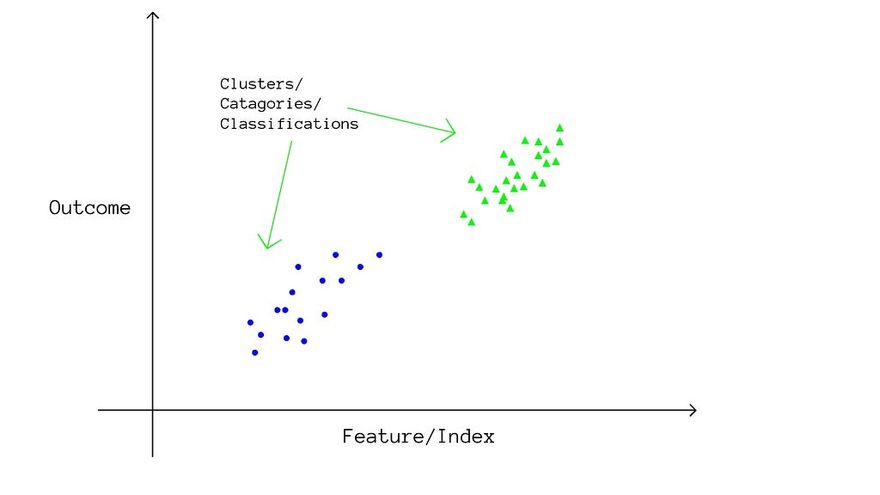
As the name suggests, in classification algorithms, the model tries to predict which category the input will belong to. One of the most typical use cases for classification is the email spam filter since we use the email data, which has many defined features like number of words, domain name, number of images, number of links, and many more, and we try to predict if the email is spam or not using those features.
In Classification algorithms, the model tries to divide each of the features in the data into different clusters or sections and tries to find a pattern in the clusters with the outcome. Like, in our email spam detection, the number of links can be divided in a way like, if the number of links is greater than 6 then most of the time, the email was spam, while if the number of links was less than 4, then most of the times the email was not spammed ( or ham ). So we divided the “number of links” feature into three clusters (categories ), less than 4, greater than 6, and the remainder ( {4, 5, 6} links ), and determined a correlation with our classification.
When such clustering is developed for all features, all of those are again assigned with weights and are further used to predict the outcome when tested.
The accuracy of the model or the evaluation of the classification model can again be evaluated using many different matrics, the most popular one being precision and recall, where we see how many classifications were predicted correctly, while how many were predicted incorrectly, and determine the score on basis of that.
The common use cases of classification on the other hand include classifying plant species, image detections, recommendation models, and many more.
Neural Networks ( Additional Topic )
Now this topic has a little bit more advanced concept, but I just want to give you a feel of what we are going to be learning, so feel free to skip this if you want, or else be ready to have some fun going deep in statistics.
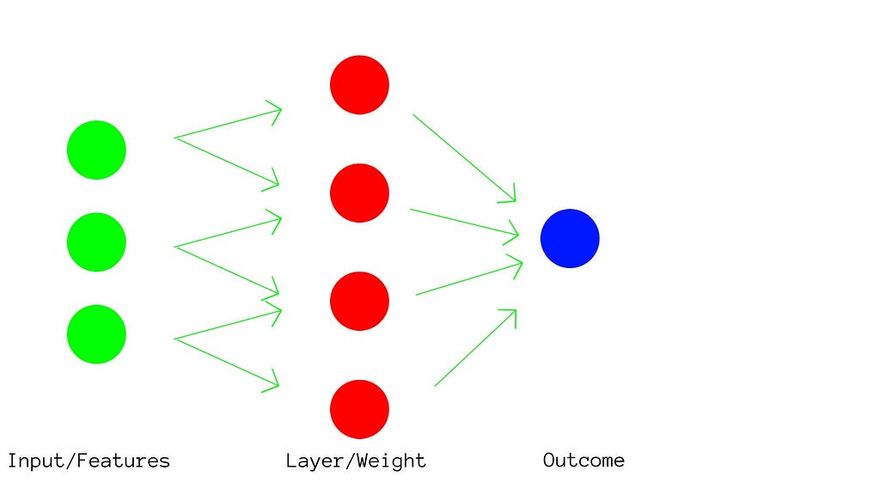
Neural Networks are a part of deep learning, where the algorithm consists of forming a neuron-like pattern, where several layers are created in order to process the features and since there is the presence of multiple layers, there is also the presence of multiple weights.
Now imagine, each and every feature, going through so much processing to determine a pattern that is not only limited to the individual correlation of features with the outcome but processing all the features together and reaching an algorithm so complex that the model becomes almost as accurate as humans. The image below should give you a small idea of how this is implemented, and we will be studying these in great detail in the upcoming articles.
Conclusion
Regression and Precision in themselves consist of many different algorithms and types, and I will surely be making an article dedicated to exploring different types of regressions and classification algorithms.
I hope you enjoyed reading the post. To follow up with the new articles, do subscribe to the newsletter on my official blog: Thinkfeed.


Top comments (1)
Our unwavering commitment bathroom fitters london to professionalism and quality is what distinguishes us.